Campaign Is A Success According to Agency “Not so Much”
Case Study using Adsperity software to monitor ad campaign
Background
A campaign was created for a software company to drive awareness and sign up for demonstrations of the company’s software product. The Adsperity product was used to track results of the campaign and then compare to the agency responsible for placing the campaign. The campaign was flighted across desktop and mobile for the purpose of promoting the software product and ultimately signing users to license the software. This campaign was a way to gain awareness and provide potential clients the ability to engage with the software product team through the website.

A word on success: Ad campaigns can and often reveal several success points. In the case of this software product, one of the key goals was set to get people to fill out a form to sign up for demonstration of software. This particular element relates to customer acquisition while other parts of the campaign relate to awareness. To understand the success of this campaign it is important to distinguish between the two. The definition of conversion and success in this instance is that users will use the form on the website and “request a demo”. While that is not explicitly acquisition it is the step towards acquisition. Moreover, an argument can be made that a potential user may spend some time on the website to gain information and over time will convert to a paying user.
Also, it is noteworthy to discuss pacing. By definition, pacing is the speed at which purchased ads are delivered based on month/day/hour. Although you can find numerous articles written on the skill sets of ad ops and their pacing practices, suffice it to say that more modern ad servers use algorithms to help with this. And even if the particular ad server cannot accomplish this, it’s a fairly simple task. Understanding your product and market render pacing what I call a “so what” checkbox.
For example, most everyone can figure out that the software company ads should not be shown to extreme North America computers at 3am. While you can argue that living in the tundra one may need our product, it is unlikely. Therefore the focus should have been on large metropolitan areas during business hours. And a targeting focus to sites that will engage highly potential users.
DoubleClick for example runs a very extensive algorithm to help ads ops make those decisions on the fly and can change them automatically.
Campaign Solution
It is important to start with understanding of the pricing and impression model of the campaign. First, the campaign had a budget spend of $25,199 to deliver a total of 5,472,426 impressions over the course of 3 months.
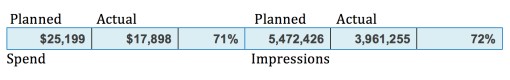
Pacing total is 85% (in this statistic pacing is percentage of planned vs. actual not the speed at which the ads are delivered unless you divide by the number of days during the campaign and derive the number of ads delivered per day.)

Targeting Channels and impressions: There were 5 channels that were targeted during this campaign. Of them, the DataPoint Display Audience received the most impressions.

The targeting and impressions are somewhat aligned with the goals at first blush. The list of targeted sites can be seen in the same vein as a target audience. The initial launch of the campaign sees that ads being run to a list of websites on desktop are correctly identified. The pacing and impressions within the campaign can be seen as being as aligned with software company goals. However, Adsperity’s SmartVision tells a different story.
Results
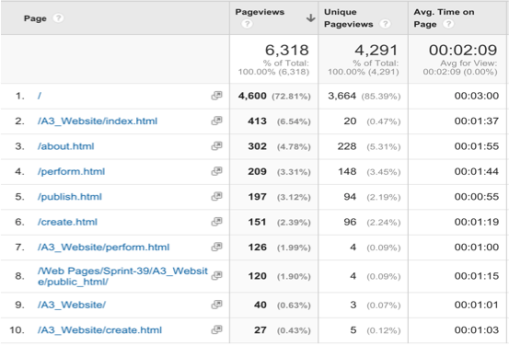
SmartVision- The results from Adsperity’s Smartvision conclude that the overall engagement of the campaign was very low. While users did go to the website. The amount of time spent on the website was low. The graph below shows that the most time spent was on the index page and the about page.
TTR and TSR: The time to read the ad ranged from 1 to 1.5 seconds and the time users actually spent reading the ad range, on average, from 0.2 seconds to 1 second. Within the algorithm this statistic indicates the accidental clicks were the majority of clicks. Those that were not in the majority indicate that most of the clicks occurred after the ad had been on the page for more than a minute. Combining these statistics gives us the performance rating, which was very low.


If we combine that with the time on the website we can see that engagement was mostly accidental. Furthermore, those who did get to the website never filled out a form. Just over 6300 pages views during the campaign at 2 filled out the form. Less than 2% clicked through to the website and virtually 0% filled out the form. This data excludes bounce rate, which can be also derived from the SmartVision’s low performance rating.
3 million ad units served, 6300 page views and 2 forms filled out.
During Ad:Tech New York several people indicated that they had seen the software product ad and visited software company booth to check out product which speaks to awareness.
There were two spikes in website and ad activity once at the beginning of the campaign and the second during Ad:Tech New York. Other than those two improvements in activity the ad campaign and website activity stayed at a steady low. As for the ads spiking it is unclear if agency changed the targeting or pacing during this time. With both increasing it is reasonably safe to conclude that there was an increase in engagement to the extent that more visitors were being pushed to the site.
Conclusion
Data points as they relate to success of campaign (ads delivered vs price paid, ads planned vs. actual, CTR) given the data points received from agency, Google Analytics and Smartvision, it is clear that there were some differences in the data. First it was clear through SmartVision that engagement remained low while accidental clicks were the majority. This was different from the “pacing model” that was given by the agency data points. While 2% of the campaign was driven to the website, and it should be noted this is roughly average, the agency data shows a more positive outlook than the SmartVision data. If the only goal was to raise awareness, this still remains the cheapest option to do so. If success also includes CTR and a request for a demo than this may have little impact by comparison to person-to-person contact. While on the subject of CTR, SmartVision concluded that the CTR was mostly false through accidental clicks. But overall the comparison to the agency data, SmartVision was clearly more informative.
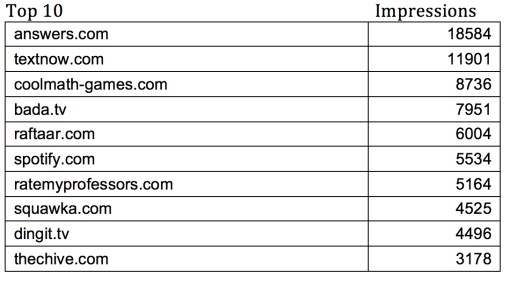
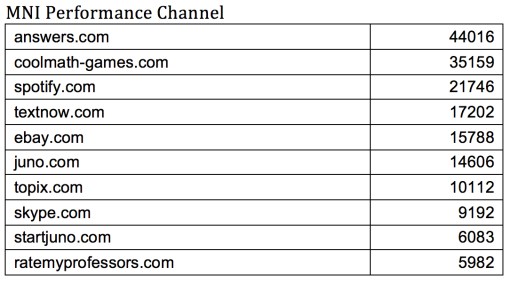
Useful data vs. popular data: Most of the data points in the campaign that were provided by the agency were based on Pacing and CTR. While that data is useful to an extent, the reality is that the data is incomplete forcing the data analyst to make “assumptions”. For example the assumption that the ads drove 2% of the views to the website, therefore there was engagement (albeit very little engagement). While CTR has a place, it was very clear given the fact that most of the time click-through happened within 0.2 seconds of the ad appearing. That was not nearly enough time for the animated ads to compete their animated sequences. These assumptions seem to be everywhere in the data. Even the targeting has an amount of assumptions. Over half of the impressions came from retargeting. Answers.com was the most targeted site during the campaign.
Audience targeting in this campaign may have had some attribution to the poor performance. While one can argue that retargeting allows for more specific audience acquisition, in this case it did not. The list of websites indicates that a few of the sites where the ad ran were outside of purview of Adsperity. In fact, the ads ran on non-English websites. Given that Adsperity is not localized to several languages, this may have had an impact on success. The list of target websites were not what Adsperity would consider viable targets for the campaign. The targeting was somewhat misleading. You can clearly see the areas and target websites (listed above), what is not as clearly evident are the exact pages the ads were shown. SmartVision gave us insight to those pages. For example there are several websites listed but the ads were redirected once they hit the targeted site to “other sites” like wuxiaworld.com, a Chinese martial arts fiction website. Or zehabesha.com, an Ethiopian news site. The overall list may have been on the “approved” list, what is not clear is why the other websites made the list. The retargeting data did not specify where the ads were run for retargeting as opposed to targeted websites. Also, there was no indication of the ad servers and networks that our ads ran through. The data from the agency did not include this information. The ad ops for the Adsperity campaign made no indication of how the targeting was done in the reporting.
Lastly, the data from SmartVision and Google Analytics (website) indicate that while there was an increase in visitors to the website during the campaign the time spent both on ads and website were negligible and lacking engagement. Awareness may have had a boost through Ad:Tech New York. Conversely, the agency data, while focused on CTR and “Conversions” shows that the campaign was minimally successful based on those criteria. If 2% is success.
Overall I was very pleased that the Adsperity product produced analytics that really told a different and more accurate story on the success or lack of success with the software company’s campaign. In today’s digital advertising space it is very difficult to gauge success without utilizing new measurement models and techniques. Agencies need to become more sophisticated in what they report. This particular case study really shows the disconnect between what an agency deems success and what the true reality of the campaign is when measured properly. We have many more exciting aspects being added to the Adsperity product and I look forward to continuing to build new case studies.
